The workflow before#
Durable Capital, an $18B investment firm, had licensed Consumer Edge consumer transaction data to sharpen its view of the companies it follows. The feed arrived, but there was nowhere to put it. Analysts pulled files by hand and blended them in Excel, and every refresh meant rebuilding the same spreadsheets. Preparation took about 40% of an analyst's week, time that should have gone to research. The data was too large to work with comfortably in a workbook, so questions that needed the full history went unanswered. The firm was paying for an edge it couldn't fully use.
What we built#
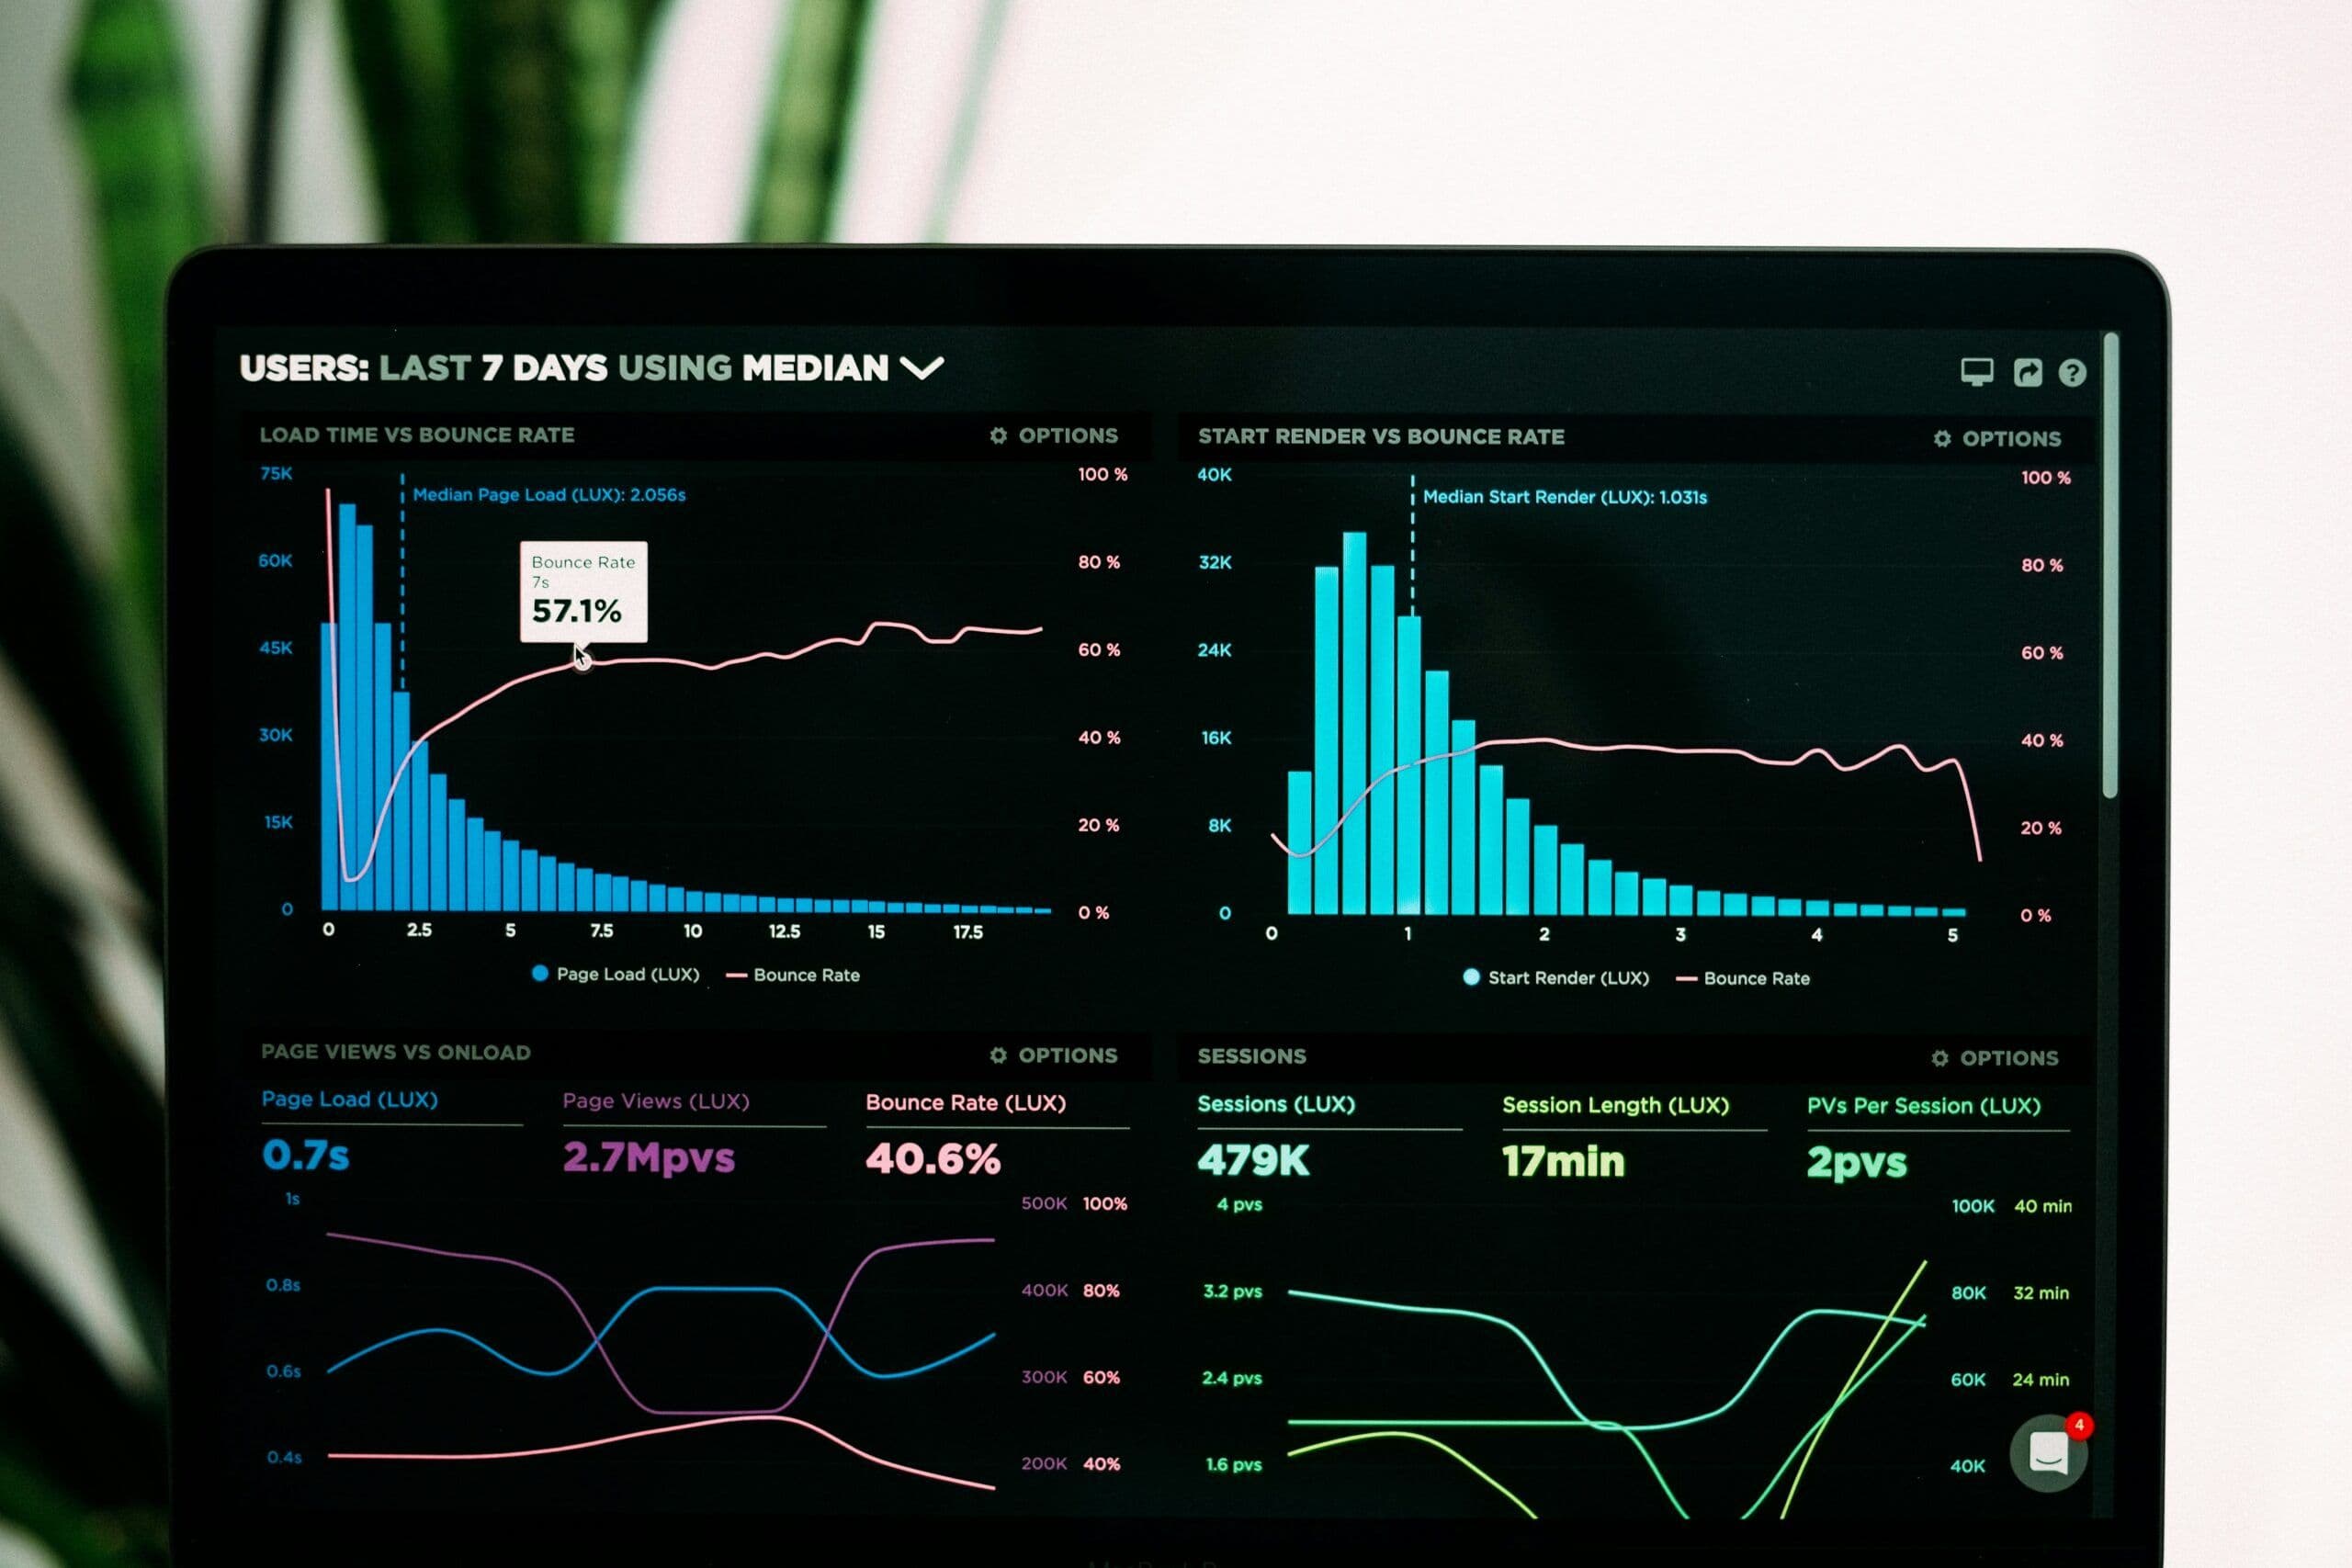
We built the missing home for the data. The raw Consumer Edge feed now gets cleaned on arrival, lands in the cloud, loads into Snowflake on a schedule and shows up in Tableau dashboards the investment team opens every morning. We did it in 8 weeks, from an empty environment to dashboards on real data.
A prep step analysts already trust
Alteryx prepares and validates the raw feed before anything loads. We kept the prep in Alteryx because the team could read and adjust those workflows themselves, so a change to the feed doesn't wait on an engineer.
A model built for reporting
In Snowflake the data moves through raw, cleaned and analysis-ready layers. Analysts query the analysis-ready layer and get consistent answers, while the raw layer keeps the original feed for audit and reprocessing. Splitting it this way means a fix upstream flows through to every dashboard.
Loads that run themselves
Airflow runs the loads on a schedule and alerts on failures. The feed refreshes without anyone rebuilding a spreadsheet, and if a load breaks, the team hears about it before an analyst opens a stale chart.
Dashboards on live data
Tableau connects live to Snowflake, so the first dashboards showed the full history at full detail. Analysts can slice the data by company, category and period instead of working from a sample.
How we delivered it
We ran the work as an 8 week build aimed at one goal: usable dashboards on the investment team's real questions. Environment setup and the Alteryx prep came first, then the Snowflake model, then the dashboards, with analysts reviewing each one against the questions they actually ask. Access runs through AWS IAM roles inside a dedicated VPC, so security was settled before the first dashboard went out.
Before and after#
| Measure | Before | After |
|---|---|---|
| Time to usable consumer data | No environment | Live dashboards in 8 weeks |
| Analyst time on data prep | About 40% of the week | About 20% |
| Feed refresh | Manual pulls | Automated scheduled loads |
| Where analysis happens | Excel workbooks | Tableau on Snowflake |
What's next#
With the consumer feed modeled in Snowflake, the next step is an analytics copilot. Analysts would ask a question of the data in plain English and get the chart back, which turns a 20 minute build into a quick check during a research call.