The workflow before#
This private equity firm brought four companies under management in 18 months, and each one arrived with its own CRM and ERP system. Deal teams spent 15+ hours a week reconciling information across those systems by hand. They often found out two portfolio companies were working the same target only after both had put in the effort. Due diligence averaged 21 days, and much of that went to hunting for data across systems. A standard integration project would have taken 6 to 9 months and pulled the firm's small technology team away from daily operations, which the firm couldn't afford.
What we built#
We built one deal data layer that pulls all four companies' CRM and ERP data into a shared warehouse, matches the records and puts deal signals and scoring in front of the investment team. A deal team can now see every relationship the firm and its portfolio have with a target in one view, and spend diligence time on the company instead of the spreadsheets.
Four systems, one view of the pipeline
Pipelines extract from each CRM and ERP on a schedule and harmonize the data in Snowflake, so a target company has one record no matter which portfolio company logged it. Overlapping pursuits show up as soon as they're logged, not after the work is duplicated. We left the source systems untouched and did the matching downstream, so the portfolio companies didn't have to change how they work.
Signals that point to the next deal
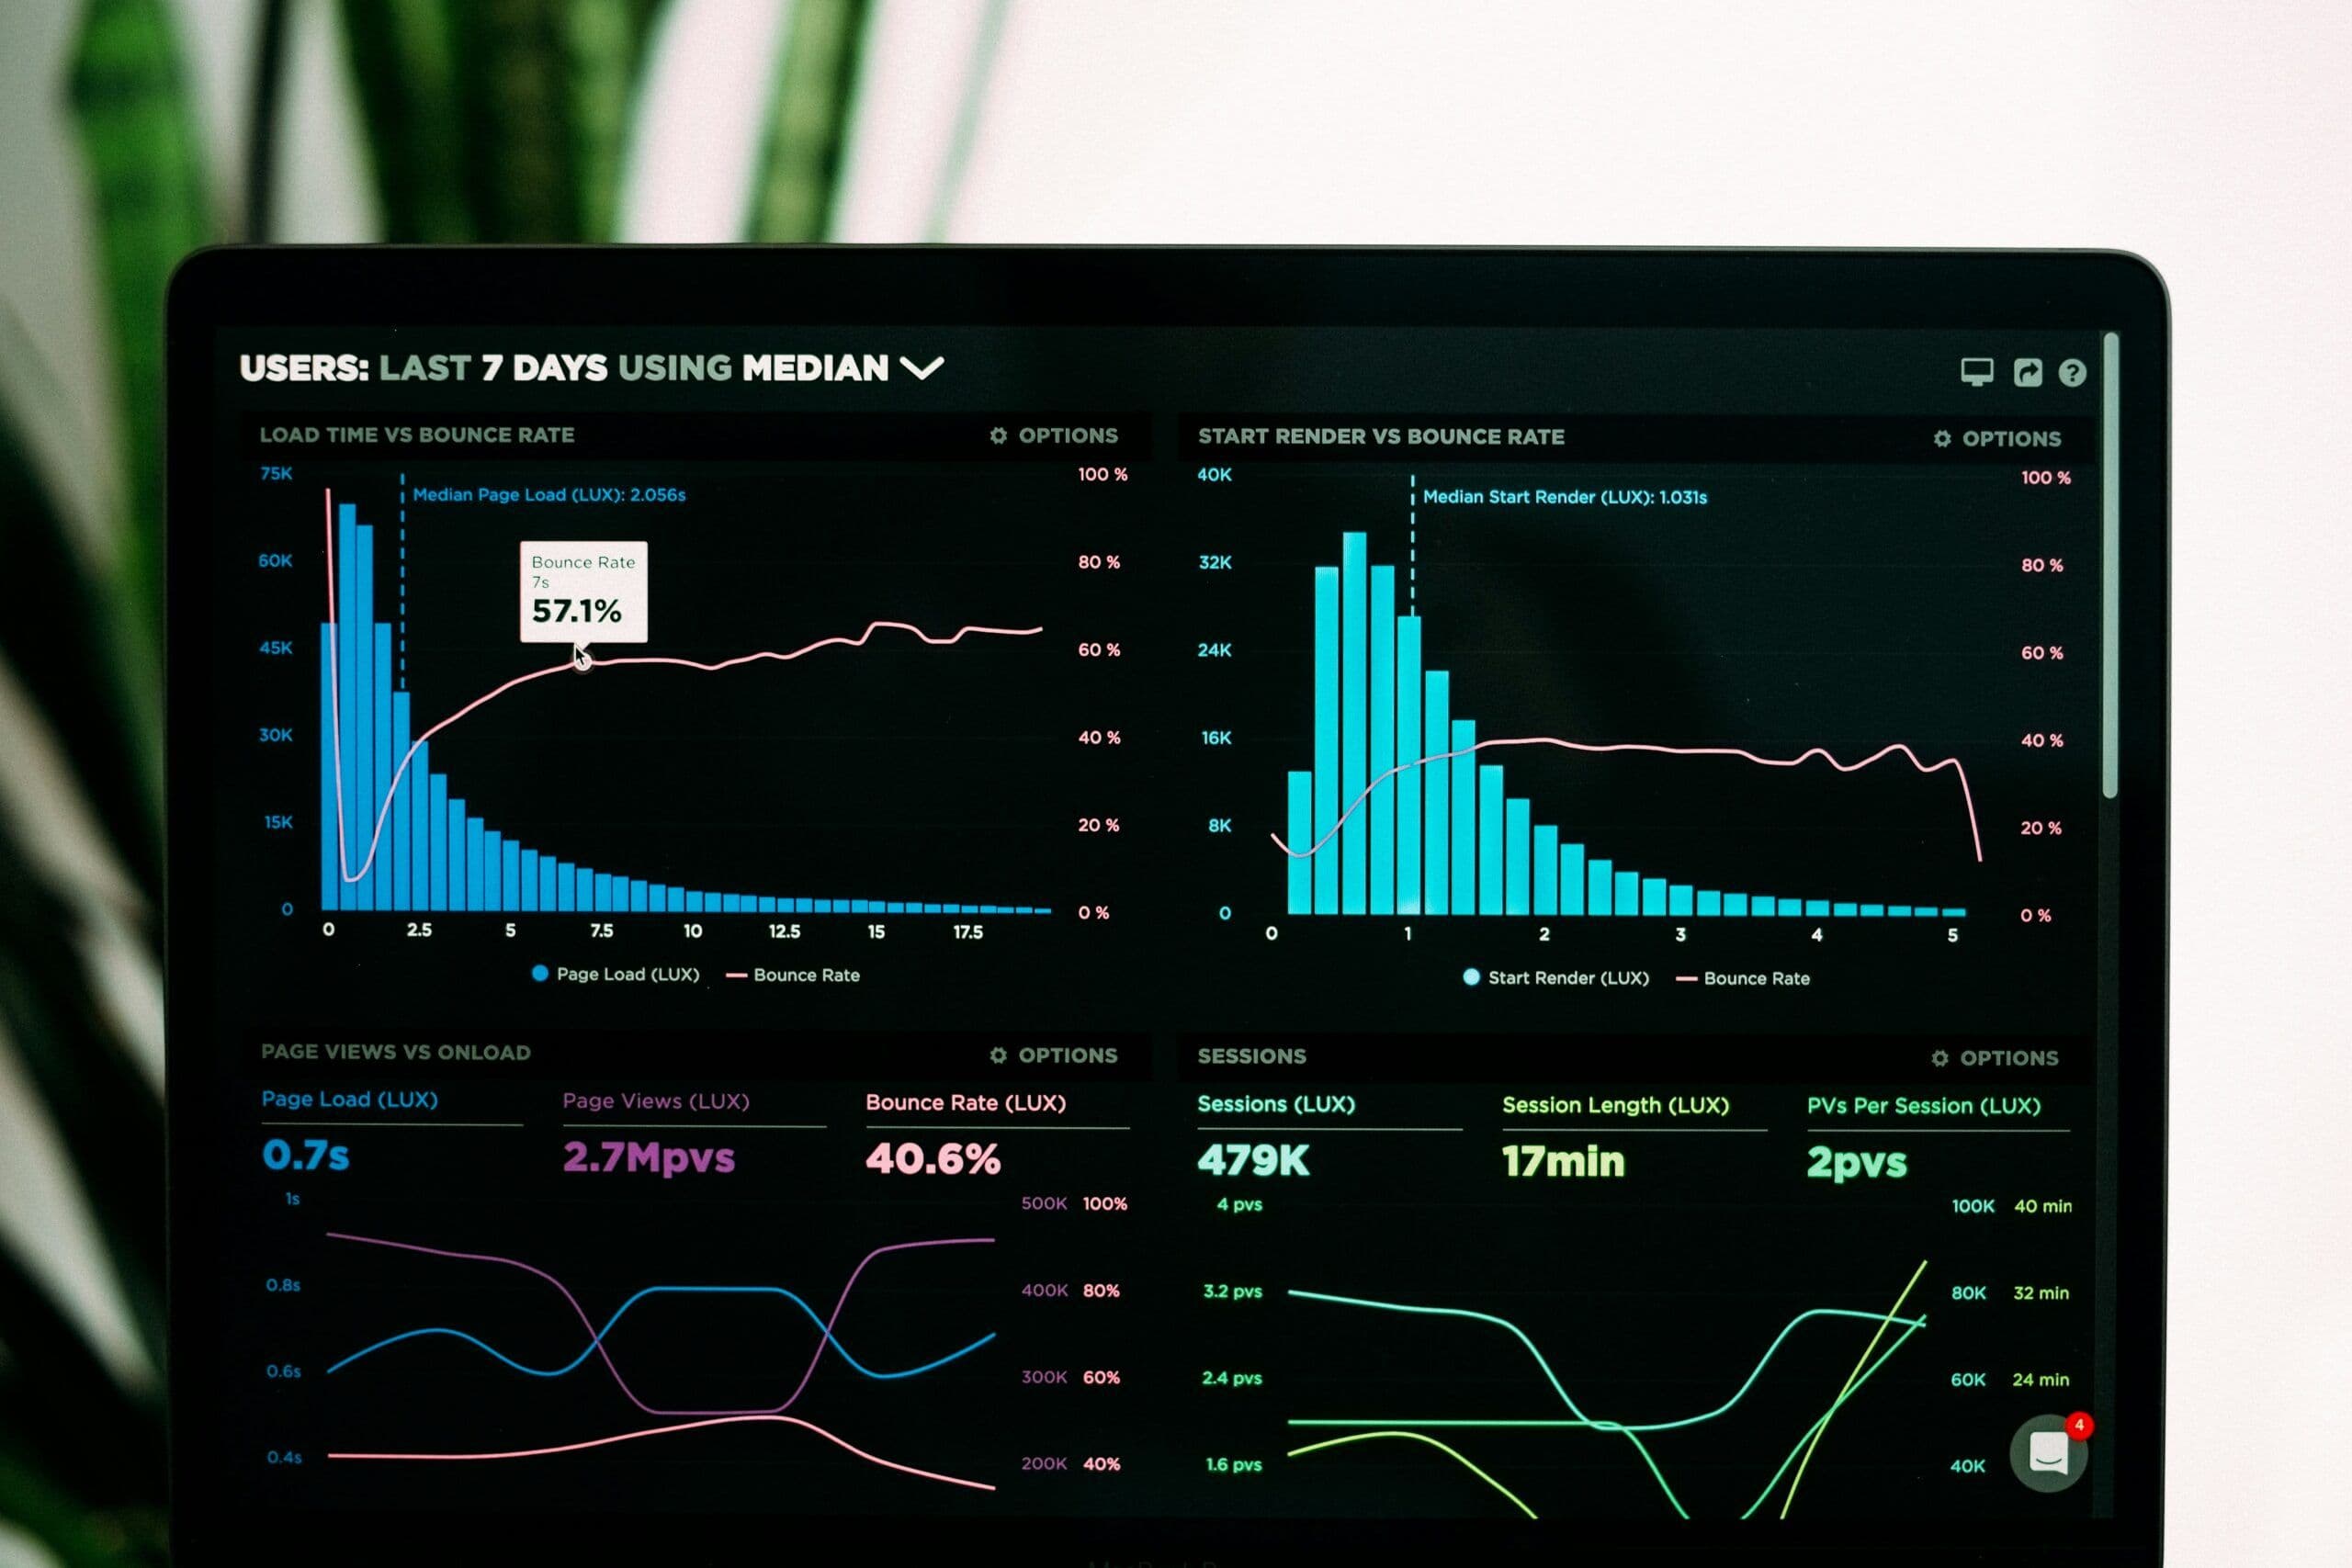
Python models score companies on growth signals such as hiring pace, web traffic, patent and regulatory filings, read the sentiment in news coverage, and map relationships between companies to surface connections the team might miss. Each signal lands as a score the deal team can sort and filter. The models suggest where to look; partners still decide where to spend time.
Dashboards for each audience
Investment teams use Tableau for deep-dive analysis, and partners get Power BI dashboards for the executive view, both reading from the same warehouse. We kept two tools on purpose because each group already worked in one. Moving everyone to a single tool would have slowed adoption without changing a single number.
How we delivered it
The build ran in 12 weeks: architecture and system mapping in weeks 1 to 3, pipelines and data unification in weeks 4 to 7, model training and validation in weeks 8 to 10, and rollout and training in weeks 11 and 12. We worked embedded with the firm's teams throughout, so its own people could maintain and extend the work after handoff.
Before and after#
| Measure | Before | After |
|---|---|---|
| Average due diligence time | 21 days | 14 days |
| Cross-system reconciliation | 15+ hours a week by hand | Automated in the pipeline |
| Systems to search for deal data | 4 separate CRM and ERP systems | 1 shared warehouse |
| Duplicate effort across deal teams | Common, found late | About 60% less |
What's next#
With deal data unified and scored, the next step is an agent that watches the signals, assembles a first-pass research package on each promising target and routes it to the right deal team for review. The team keeps the judgment, and the agent takes over the first round of research.