
The 30-Second Question That Takes 30 Days to Answer
Picture this: It's Monday morning, and your CEO asks a simple question: "Why did our Q3 sales drop 15% in the Northeast region?"
What should happen: A quick data query and instant visualization showing the breakdown by product, channel, and timeframe.
What actually happens: The request goes to your analytics backlog. Three weeks later, you get an answer—but Q4 is already underway, and the opportunity to respond has passed.
It could take up to a month to produce reports and dashboards, by which time the underlying data was often obsolete or the opportunity for actionable insights was missed.
This isn't just inefficiency—it's the fundamental barrier preventing organizations from being truly data-driven. What once seemed like a simple question in an executive meeting, is now what's standing in the way of taking the next best business action.
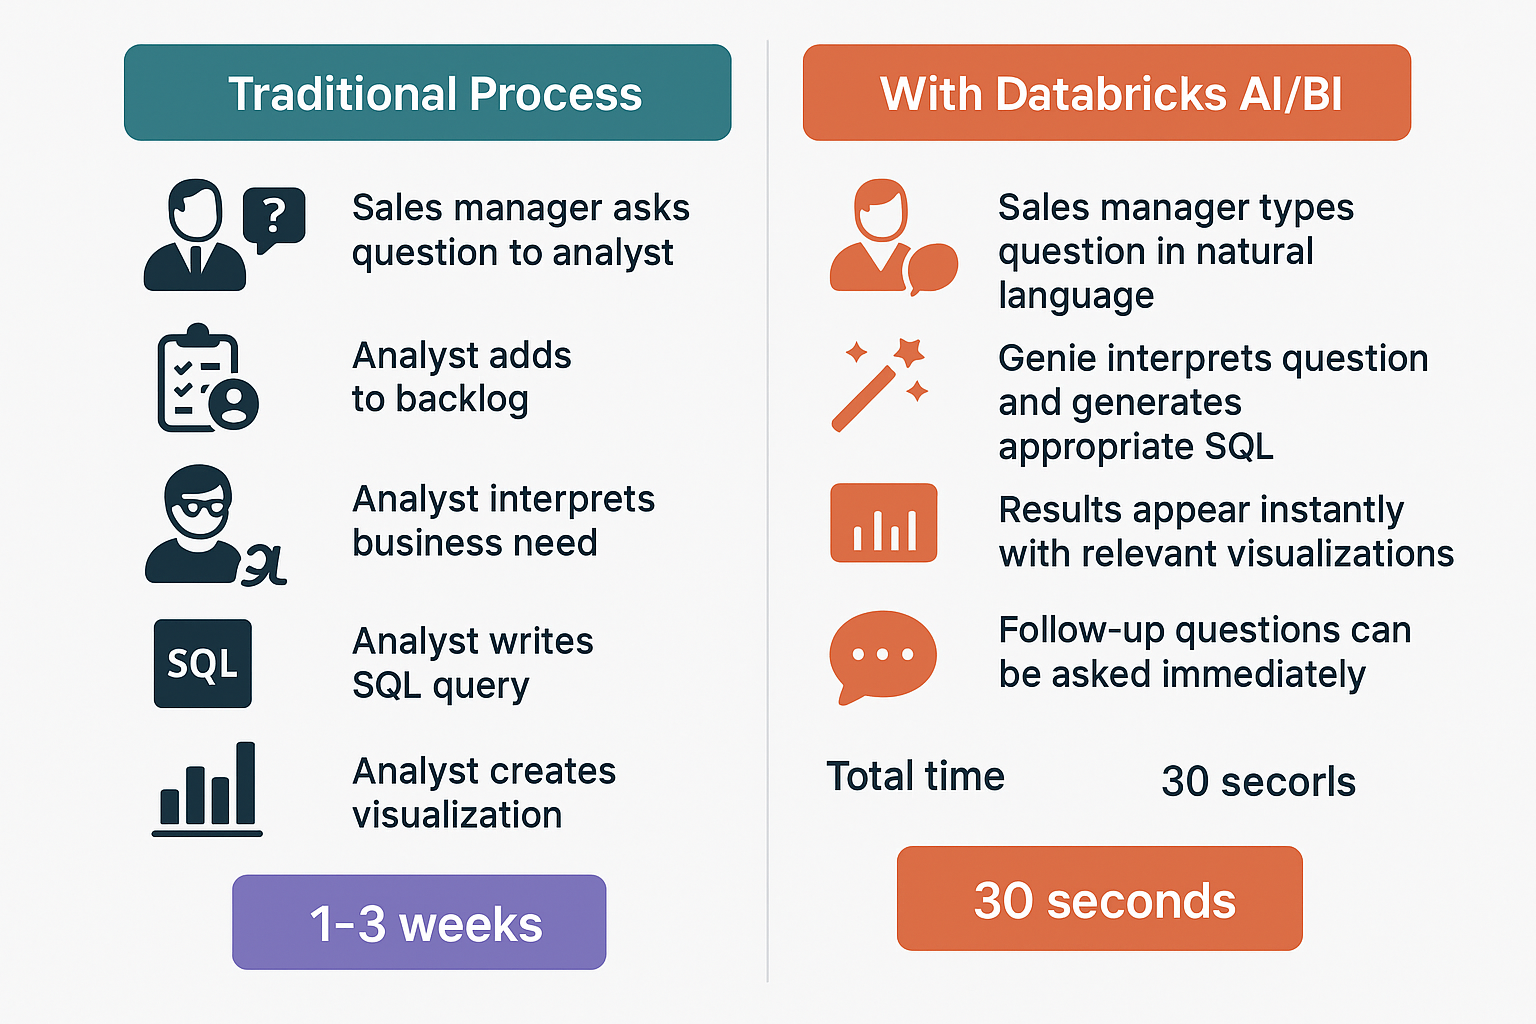
The problem isn't your data or your team. It's the translation gap between business questions and technical execution. Every inquiry goes through multiple layers: business language → analyst interpretation → SQL queries → visualization → validation. Each handoff adds delays, and traditional analytics typically involve manual processes and require specialized skills in areas such as data science and statistics. These prerequisites can lead to bottlenecks in the analysis process.
What if that same question could be answered in 30 seconds instead of 30 days?
The Natural Language Revolution: AI That Speaks Business
Databricks AI/BI fundamentally changes how people interact with data through Genie, an AI assistant that understands business questions in plain English. Genie interprets natural language queries, allowing users to type questions in plain English without SQL knowledge. For instance, if a sales manager wants to know, "What were our top-performing products last month?" Genie retrieves the relevant data directly.
But Genie isn't just a simple query tool—it's powered by what Databricks calls a "compound AI system" with multiple specialized agents working together to understand context, generate accurate queries, and create appropriate visualizations.
How the Magic Works
Intelligent and Adaptive
Genie uses agentic reasoning to refine its understanding of your questions. When unsure how to answer, it asks you for clarification to improve its knowledge. It learns your business terminology—when you define "churned customers," it applies that understanding to future questions about retention, lifetime value, and engagement.
Most importantly, Genie provides complete transparency. Users can see the SQL query generated, which data sources were used, and the confidence level in results. This builds trust while maintaining the simplicity of natural language interaction.
Enterprise-Grade Governance
The biggest concern about self-service analytics is control. Will users access inappropriate data? Create conflicting metrics? Make decisions based on wrong information?
Integration with Unity Catalog ensures compliance with your existing data access and governance policies, giving you confidence that answers are secure and auditable. Users can only access data they're already authorized to see, business metrics are centrally defined, and every query is logged for complete audit trails.
Power BI Integration: Supercharging Your Existing Investment
Most organizations have significant investments in Power BI—trained teams, established dashboards, and embedded business processes. Databricks doesn't require abandoning this investment. Instead, it supercharges it.
Seamless, Secure Connection
Native integration among Unity Catalog, Power BI, and Microsoft Entra ID means best-in-class security, governance, and observability. Users access both platforms with the same credentials, data access rules apply consistently, and schema changes automatically sync between systems.
Real-Time Data Without the Overhead
Users can now update and refresh Power BI semantic models directly from Databricks. This leads to better total cost of ownership, higher efficiency, and ensures data is up-to-date for Power BI report and dashboard consumers.
Instead of complex ETL processes extracting data into separate warehouses, Power BI directly queries the Databricks lakehouse. This means always-current data, reduced infrastructure costs, and simplified architecture.
Performance at Scale
SQL Warehouses are tuned for analytical workloads, providing low-latency and high-performance query execution for Power BI dashboards and reports. Auto-scaling, intelligent caching, and query optimization ensure instant response times even with massive datasets and concurrent users.
Proven Results: Organizations Are Seeing Dramatic Impact
The 25-Hour Liberation
Organizations report reallocating an impressive 25 hours per week towards driving digital transformation efforts when implementing effective self-service analytics. That's more than half a full-time analyst's capacity redirected from repetitive reporting to strategic analysis.
Real Example:
- Before: Data analyst spends 30 hours/week on ad-hoc requests, 47-item backlog with 2-week average turnaround
- After: Business users self-serve 80% of questions instantly, analyst spends 5 hours/week on complex requests, 25 hours freed for predictive analytics on churn and inventory optimization
Unprecedented Adoption Success
Organizations achieve 78% adoption rates with effective self-service analytics implementations, compared to typical BI tool adoption rates of 20-30%. The rise of self-service analytics democratized the data product chain. Suddenly, advanced analytics isn't only for analysts.
Speed Transformation
Stop waiting for answers from your data practitioners. Get instant insights for the decisions you need to make right now.
Real scenarios:
- Sales question: "Which leads from last month's webinar are most likely to close?" Traditional: 3-5 days → AI/BI: 30 seconds
- Marketing question: "How do paid search customers behave vs. organic traffic?" Traditional: 1-2 weeks → AI/BI: 2 minutes
- Operations question: "What's driving this week's support ticket spike?" Traditional: 2-3 days → AI/BI: 5 minutes
Getting Started: Your Roadmap to Analytics Transformation
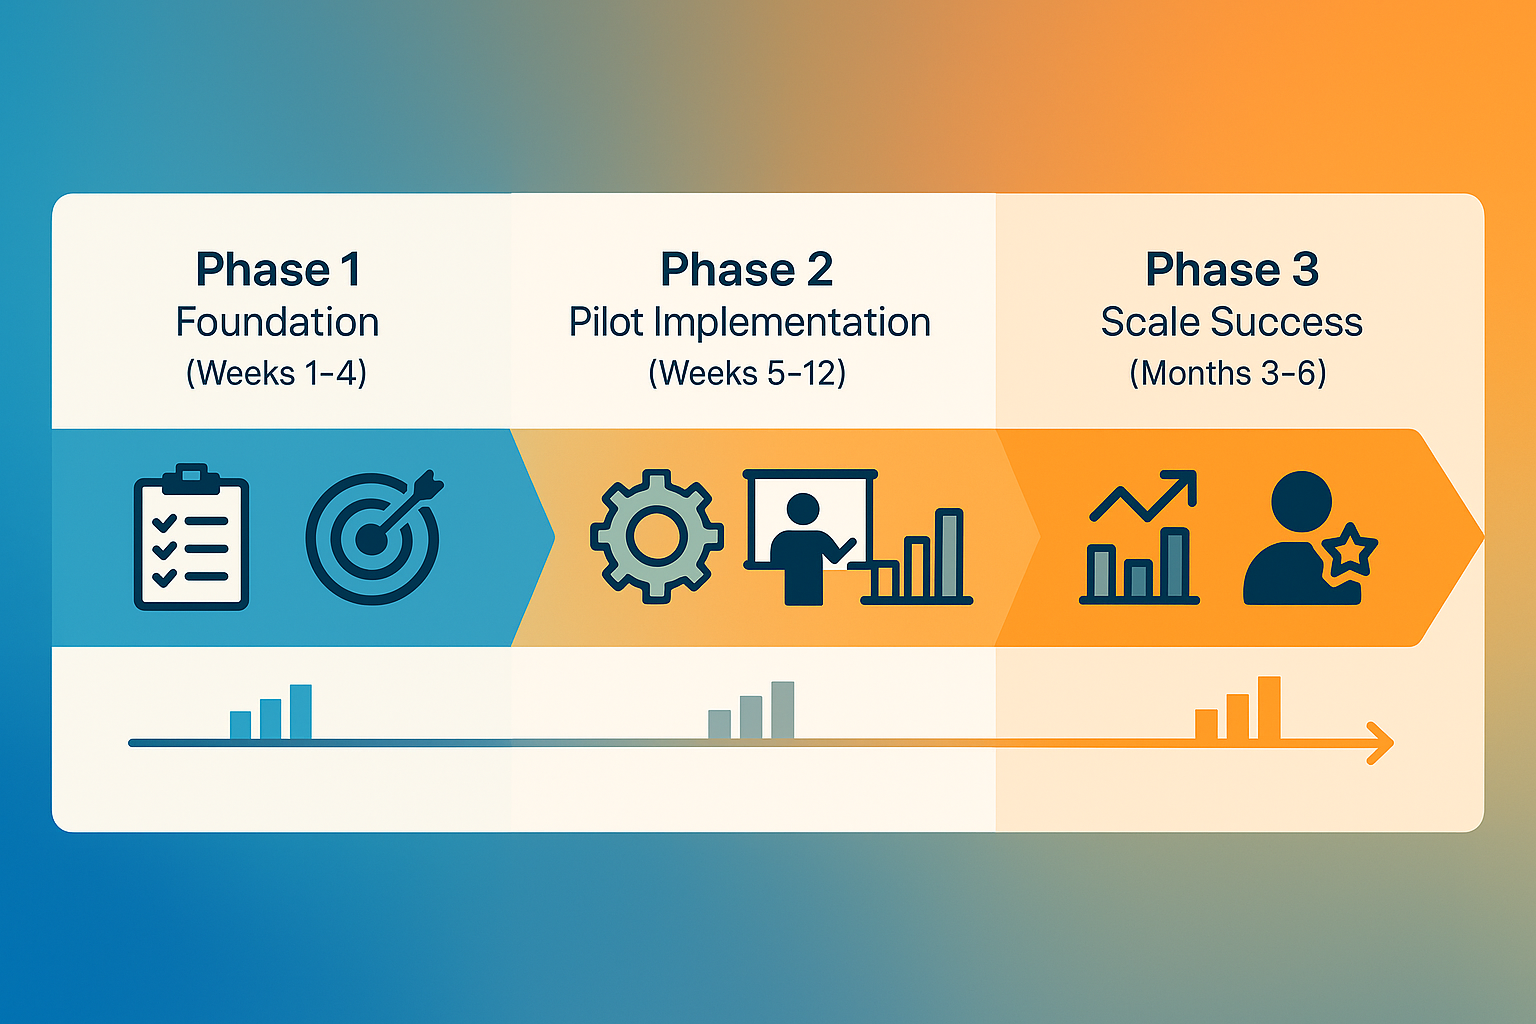
Phase 1: Foundation (Weeks 1-4)
- Audit current bottlenecks: Identify your team's most frequent data requests and pain points
- Select pilot use cases: Start with high-value, routine questions by department:
- Sales: "Show me pipeline by region for Q4"
- Marketing: "What campaigns drove the most qualified leads?"
- Operations: "Which products have the highest return rates?"
- Finance: "Break down expenses by department and month"
- Prepare data governance: Ensure Unity Catalog has proper business-friendly naming and definitions
Phase 2: Pilot Implementation (Weeks 5-12)
- Configure Genie spaces with sample queries and business terminology
- Set up Power BI integration for existing dashboard users
- Train pilot users with hands-on sessions and department-specific examples
- Measure and iterate based on usage patterns and feedback
Phase 3: Scale Success (Months 3-6)
- Expand based on pilot wins: Add more departments and use cases
- Develop internal champions: Train power users to support their teams
- Track business impact: Document time savings, improved decisions, and user satisfaction
Overcoming Common Concerns
"What about data quality?" Unity Catalog provides centralized governance, data lineage visibility, and built-in quality indicators. When the exact text of a parameterized example query or SQL function is used to generate a response, Genie marks the response as Trusted.
"Will users break something?" Read-only access by default, existing permission systems enforced, and comprehensive audit trails ensure security without limiting exploration.
"How do we ensure adoption?" Start with high-value use cases, provide clear examples, celebrate early wins, and integrate analytics into existing business processes rather than making it a separate activity.
Your Analytics Transformation Starts Now
The return on investment compounds over time:
- Immediate: 60-80% reduction in time-to-insight, 25+ hours of analytical capacity freed weekly
- Short-term: 78% user adoption rates, measurable improvements in decision speed and quality
- Long-term: Cultural transformation enabling continuous innovation and competitive advantage
The technology exists today to eliminate your analytics backlog. Organizations implementing these capabilities report fundamental shifts in how they operate—from reactive to proactive decision-making, from data scarcity to data abundance, from centralized to distributed intelligence.
The future belongs to those who are fast, and speed in business increasingly means analytical agility. While you're considering this transformation, your competitors may already be implementing similar capabilities.
The question isn't whether this change will happen—it's whether your organization will lead it or lag behind.
Ready to Transform Your Analytics?
The technology to turn any business question into instant insights is available today. Every day you wait is another day of missed opportunities, delayed decisions, and frustrated teams.
At Blue Orange Digital, we've helped dozens of organizations implement Databricks AI/BI and achieve these transformational results. As a certified Databricks Partner and data & analytics consulting firm, we understand both the technical implementation and the organizational change management required for success.
Here's how we can help you get started:
Assessment & Strategy (Week 1): We'll audit your current analytics bottlenecks, identify high-impact use cases, and create a transformation roadmap tailored to your organization.
Rapid Implementation (Weeks 2-8): Our certified Databricks experts will configure AI/BI and Power BI integration, set up governance frameworks, and train your pilot users for immediate success.
Scale & Optimize (Months 3-6): We'll help you expand across departments, develop internal champions, and measure business impact to ensure sustainable adoption.
Don't navigate this transformation alone. Our team has the expertise to accelerate your journey from weeks-to-insights to zero-to-insights, while avoiding common implementation pitfalls.
Ready to eliminate your analytics backlog?
🚀 Learn about our Databricks partnership and services
💡 Attend a free Databricks workshop - Join our hands-on sessions where you'll experience AI/BI capabilities firsthand and see exactly how natural language analytics can transform your organization.
Additional ways to get started:
- Schedule a free analytics assessment to identify your transformation opportunities
- Request a live demo of Databricks AI/BI with your own data and use cases
- Download our implementation guide with proven best practices from real client engagements
Your data exists. Your team has questions. The technology to connect them instantly is here. Let Blue Orange Digital help you make it happen.
The future of data-driven organizations isn't coming—it's here. The only question is when you'll join it.
What would change in your organization if every business question could be answered in seconds instead of weeks? Let's find out together.
